Power AutomateからExcelにデータを出力する方法をよく聞かれるのでメモ。
やりたいこと
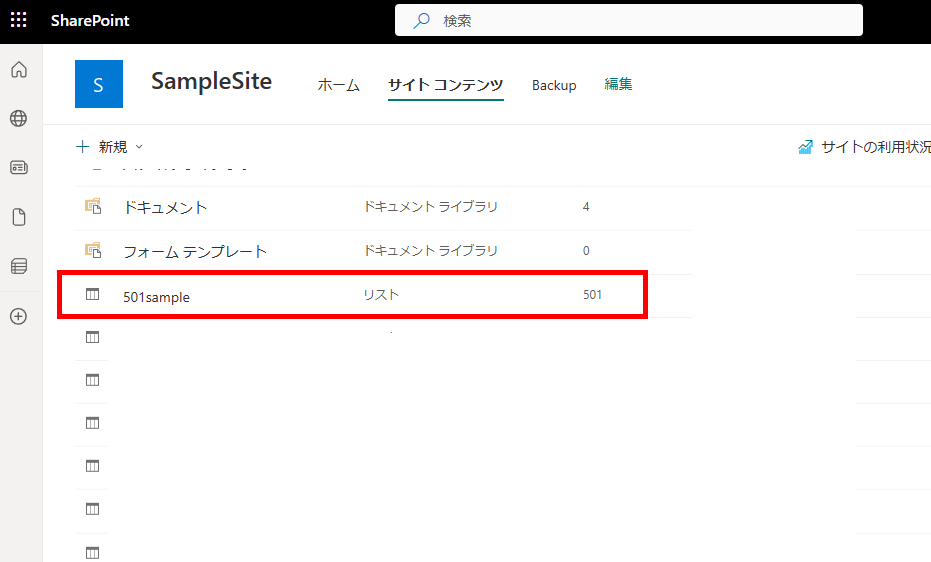
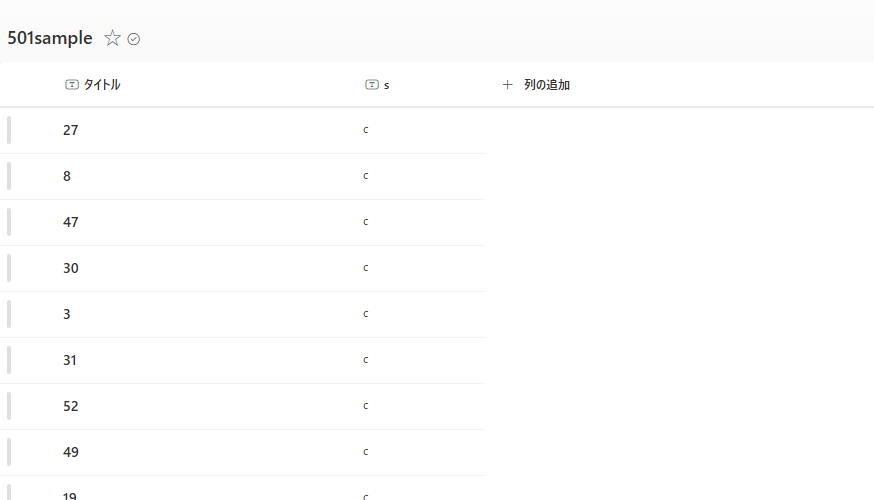
Power Automateから大量のデータ(今回は501件のアイテムがあるSPOリストの内容)を、Excelに出力したいときのお話。
今回試したのは以下の3つ。
- Excel Onlineの「表に行を追加」アクション
- Office スクリプト
- おまけ:CSV
今回はサンプルなのでSPOリストをPower Automateから出力してますが、SPOリストをExcelにエクスポートするときは、SharePointの「Excelにエクスポート」機能を使用するのが一番手軽です。
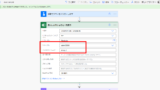
Excel Onlineのアクション「表に行を追加」
まずは最も単純なExcel Onlineのアクションを使用する方法。
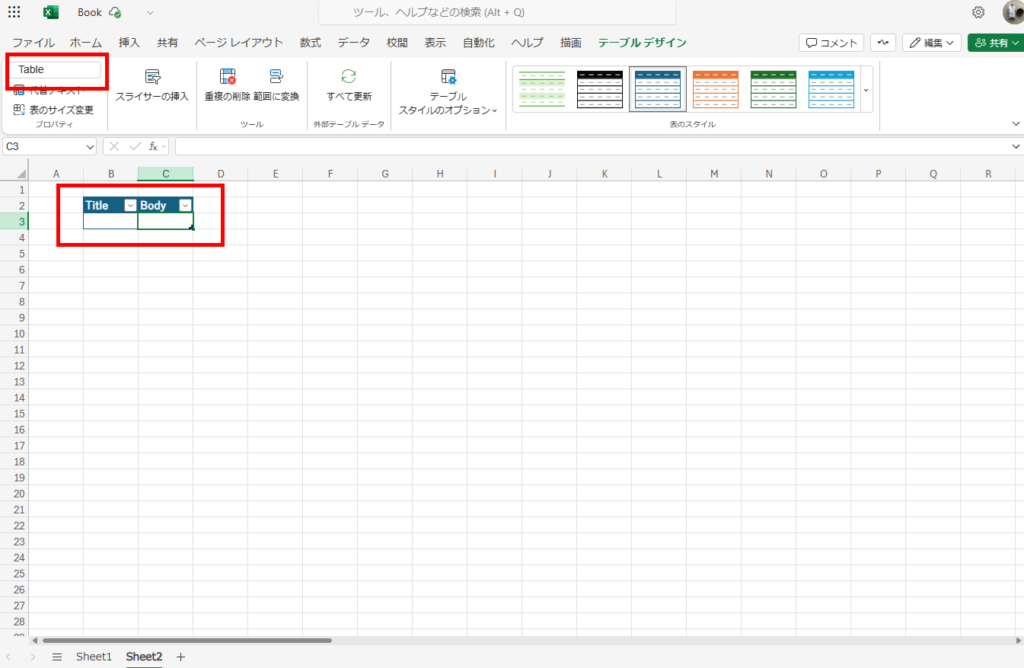
Excelにテーブルを作成し、
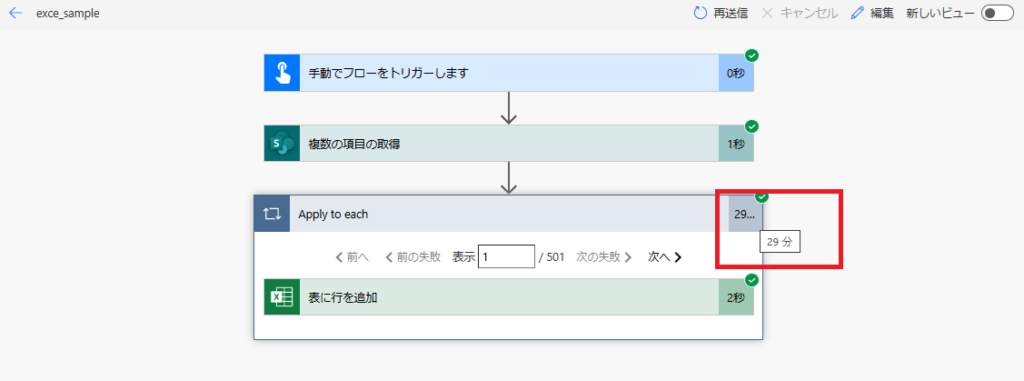
Power AutomateからApply to eachで一つ一つ転記する。
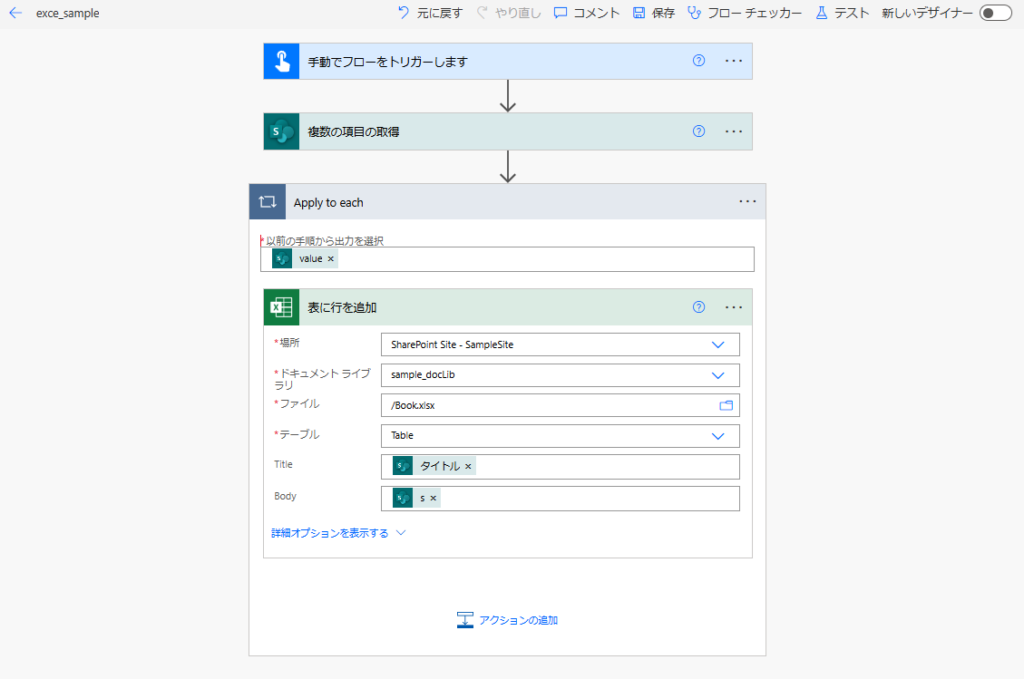
一番構築がわかりやすいけど、501件で29分かかってしまう。
※タイミングや環境によって前後します。
※タイミングや環境によって前後します。
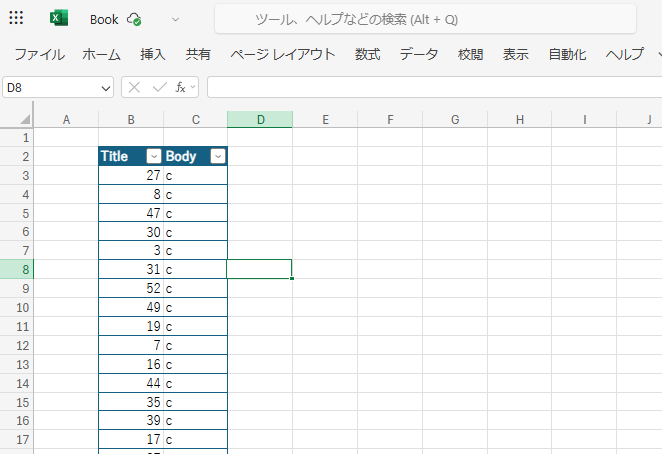
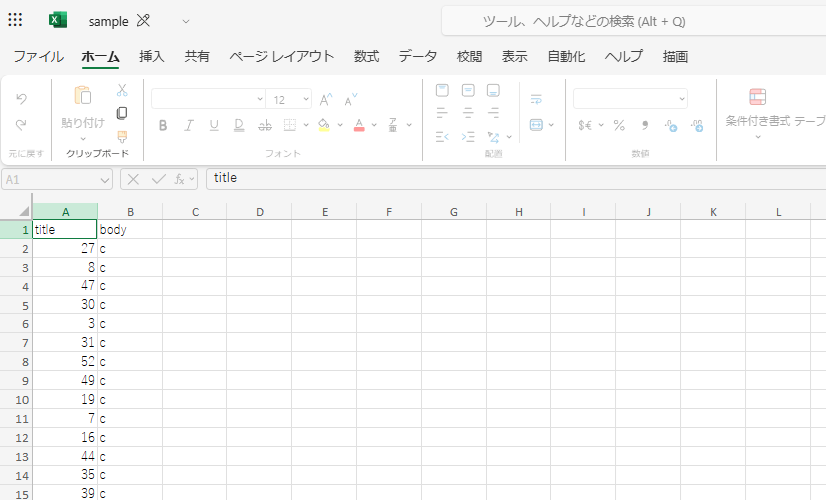
出力はこんな感じ。
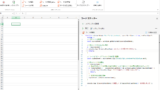
Office スクリプト
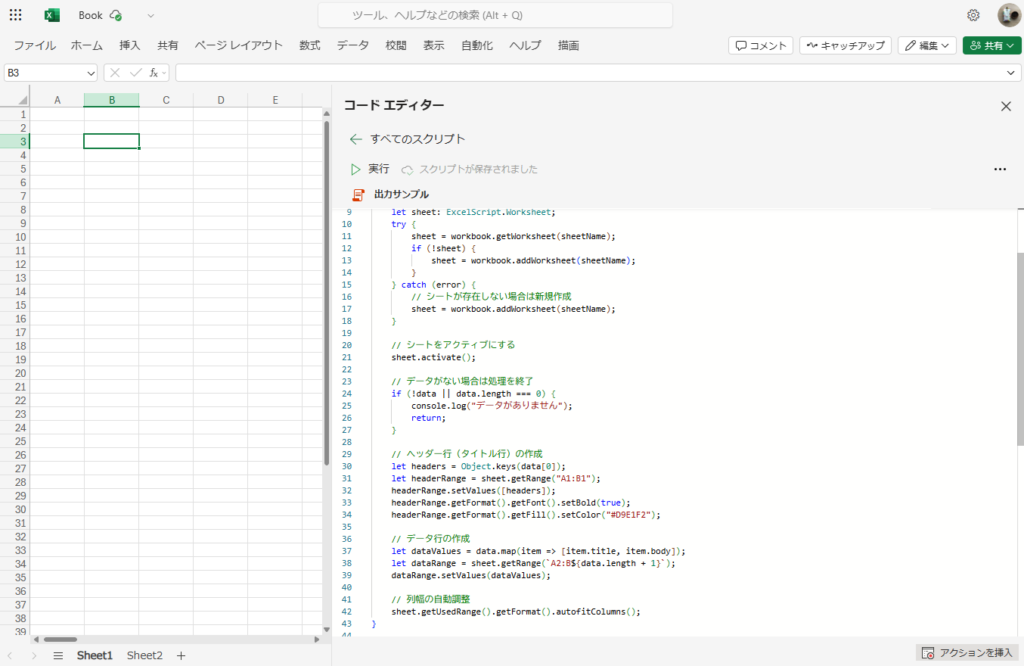
続いてOfficeスクリプトを使用する方法。コードは以下の通り。
/**
 * タイトル行とデータを指定したワークシートに出力する関数
 * @param workbook - Excel ワークブックのコンテキスト
 * @param sheetName - データを出力するシートの名前
 * @param data - titleとbodyプロパティを持つオブジェクトの配列
 */
function main(workbook: ExcelScript.Workbook, sheetName: string, data: { title: string, body: string }[]): void {
    // データがない場合は処理を終了
    if (!data || data.length === 0) {
        console.log("データがありません");
        return;
    }

    // 指定されたシートを取得(存在しない場合は作成)
    let sheet: ExcelScript.Worksheet;
    try {
        sheet = workbook.getWorksheet(sheetName);
        if (!sheet) {
            sheet = workbook.addWorksheet(sheetName);
        }
    } catch (error) {
        // シートが存在しない場合は新規作成
        sheet = workbook.addWorksheet(sheetName);
    }

    // シートをアクティブにする
    sheet.activate();

    // ヘッダー行(タイトル行)の作成
    let headers = Object.keys(data[0]);
    // サンプルなので出力範囲固定
    let headerRange = sheet.getRange("A1:B1");
    headerRange.setValues([headers]);
    headerRange.getFormat().getFont().setBold(true);
    headerRange.getFormat().getFill().setColor("#D9E1F2");

    // データ行の作成
    let dataValues = data.map(item => [item.title, item.body]);
    let dataRange = sheet.getRange(`A2:B${data.length + 1}`);
    dataRange.setValues(dataValues);

    // 列幅の自動調整
    sheet.getUsedRange().getFormat().autofitColumns();
}
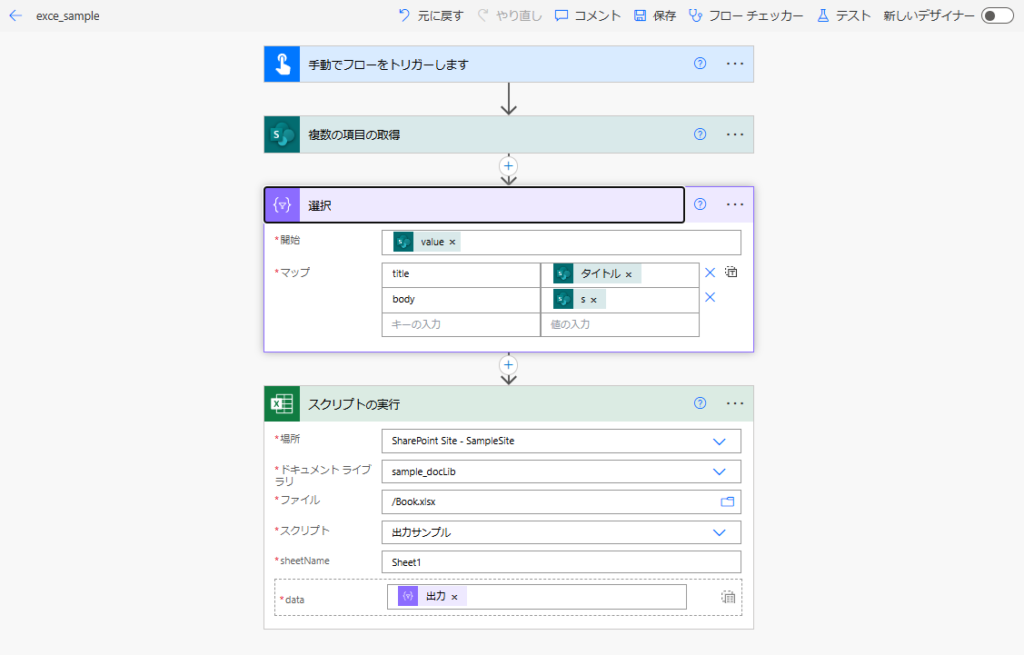
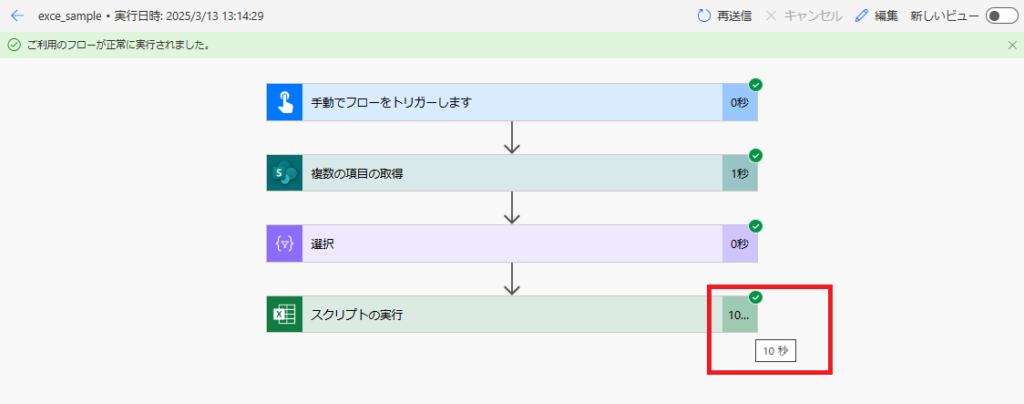
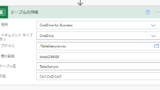
Power Automateから呼ぶときは、「選択」アクションでスクリプトの引数の型に合わせたデータを用意して、実行する。
結果は10秒で、Excel Onlineのアクションより圧倒的に速い。
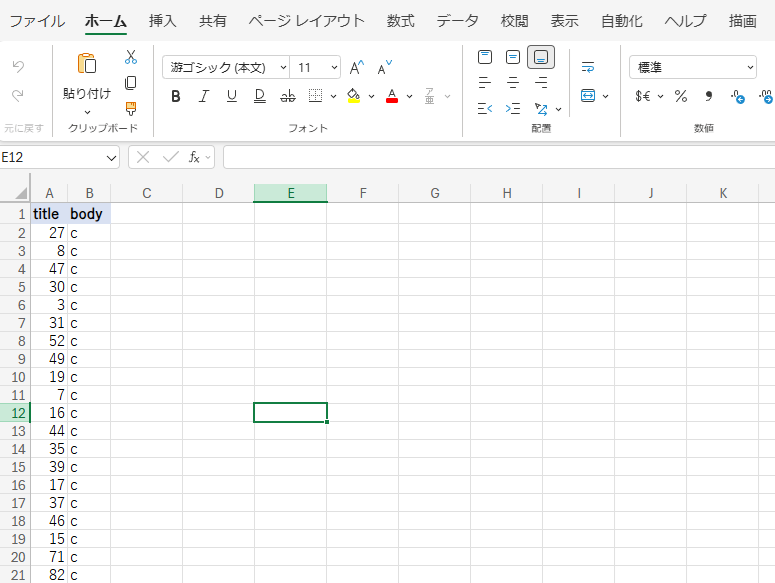
出力はこんな感じ。
※出力をテーブル化することも可能。→おまけ2参照。
※出力をテーブル化することも可能。→おまけ2参照。
もちろんヘッダの開始位置を変えることも可能だし、柔軟に出力方法を変えることも可能なので、Power Automateから大量のデータをExcelに吐き出す場合はOfficeスクリプトがおすすめ。
おまけ1:csvでの出力
もし仕様が「出力したデータをExcelで見れればOK」で、Officeスクリプトを組むのが面倒であれば、CSVでの出力もあり。
こんな感じでPower Automateを組めば、
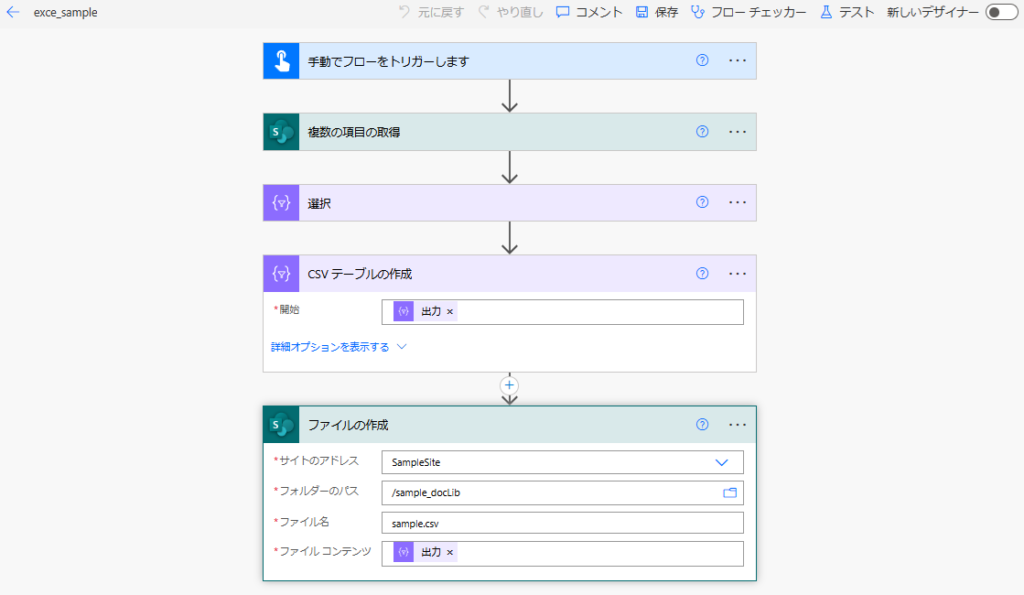
約2秒ほどで処理が完了して、
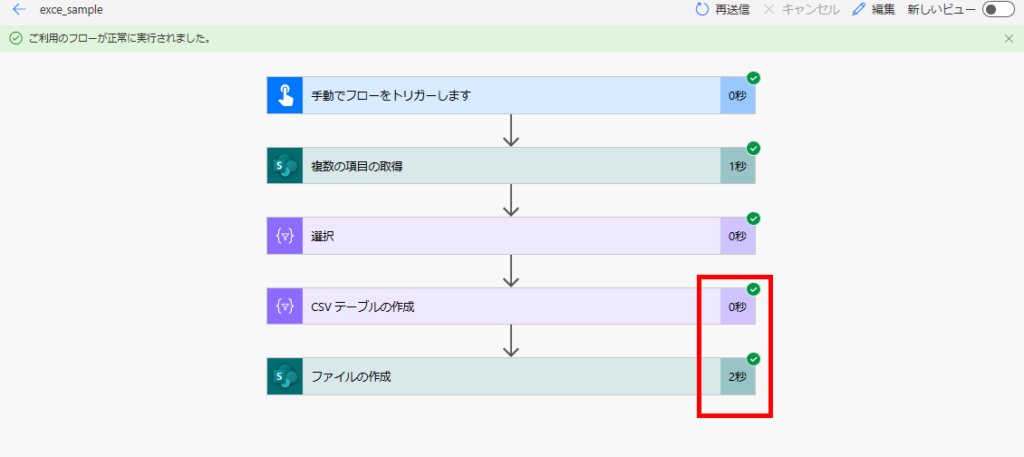
Excelで内容を確認できる。
※ただし日本語を出力すると文字化けすることがあるので、その際はBOMを付けて出力する。
※ただし日本語を出力すると文字化けすることがあるので、その際はBOMを付けて出力する。
おまけ2:Officeスクリプトで出力した範囲をテーブル化する
Officeスクリプトで出力するコードに、以下の処理を追加すれば、出力結果をテーブル化することも可能。
※今回テーブル名は固定文字列(SampleTable)を入れてるけど、引数から取得しても動的に連番を振ってもOK。
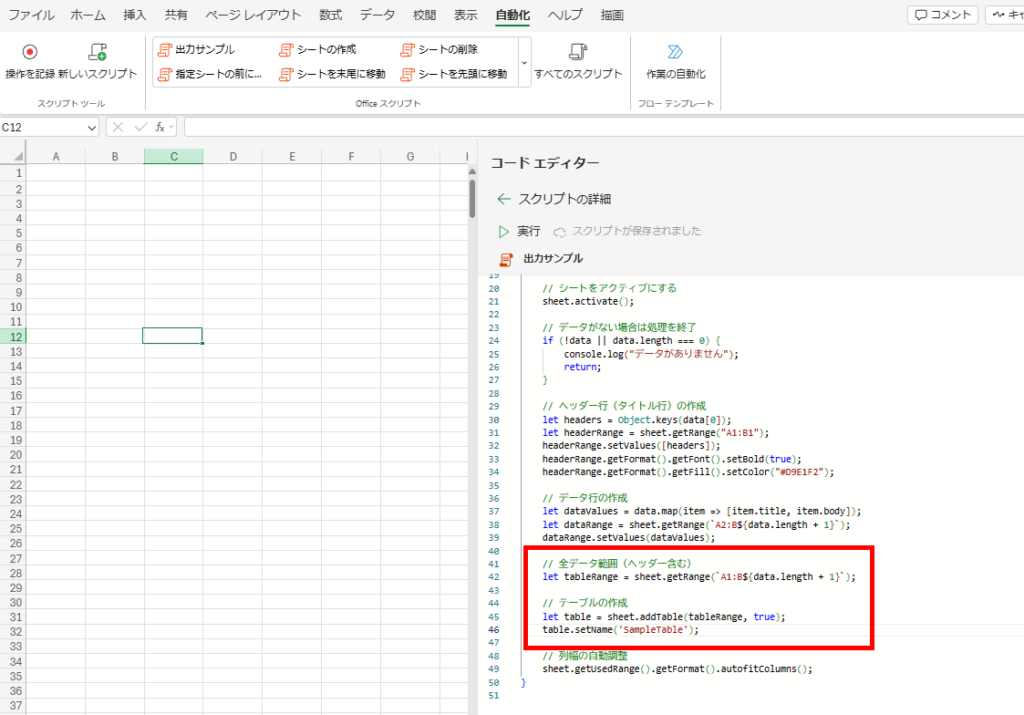
※今回テーブル名は固定文字列(SampleTable)を入れてるけど、引数から取得しても動的に連番を振ってもOK。
/**
 * タイトル行とデータを指定したワークシートに出力する関数
 * @param workbook - Excel ワークブックのコンテキスト
 * @param sheetName - データを出力するシートの名前
 * @param data - Titleとbodyプロパティを持つオブジェクトの配列
 */
function main(workbook: ExcelScript.Workbook, sheetName: string, data: { title: string, body: string }[]): void {
    // データがない場合は処理を終了
    if (!data || data.length === 0) {
        console.log("データがありません");
        return;
    }

    // 指定されたシートを取得(存在しない場合は作成)
    let sheet: ExcelScript.Worksheet;
    try {
        sheet = workbook.getWorksheet(sheetName);
        if (!sheet) {
            sheet = workbook.addWorksheet(sheetName);
        }
    } catch (error) {
        // シートが存在しない場合は新規作成
        sheet = workbook.addWorksheet(sheetName);
    }

    // シートをアクティブにする
    sheet.activate();

    // ヘッダー行(タイトル行)の作成
    let headers = Object.keys(data[0]);
    let headerRange = sheet.getRange("A1:B1");
    headerRange.setValues([headers]);
    headerRange.getFormat().getFont().setBold(true);
    headerRange.getFormat().getFill().setColor("#D9E1F2");

    // データ行の作成
    let dataValues = data.map(item => [item.title, item.body]);
    let dataRange = sheet.getRange(`A2:B${data.length + 1}`);
    dataRange.setValues(dataValues);

    // 全データ範囲(ヘッダー含む)
    let tableRange = sheet.getRange(`A1:B${data.length + 1}`);

    // テーブルの作成
    let table = sheet.addTable(tableRange, true);
    // サンプルなのでテーブル名は固定(動的に連番を付けるか、存在チェックが必要)
    table.setName('SampleTable');

    // 列幅の自動調整
    sheet.getUsedRange().getFormat().autofitColumns();
}
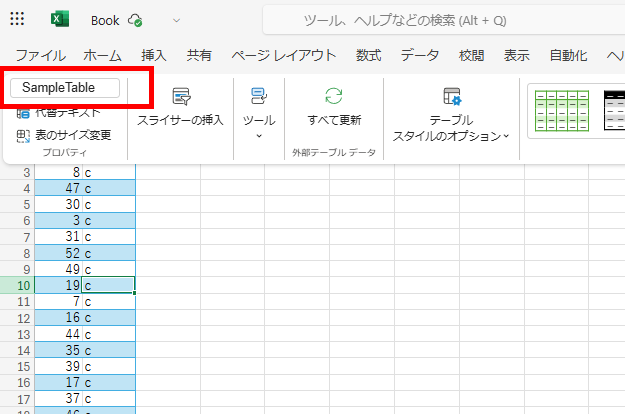
結果はこんな感じで、きちんとテーブル化されている。
コメント