Power AutomateにあるExcelのアクション「スクリプトの実行」がかなり便利だったので遊んでみた。
参考サイト

Excel Online限定のOffice スクリプトを使用してグラフを作成し、そのグラフを画像としてPower Automateでメール送信してみる。
Excelの準備
まずは参考サイトからサンプルExcel(email-chart-table.xlsx)をダウンロードし、
https://docs.microsoft.com/ja-jp/office/dev/scripts/resources/samples/email-images-chart-table#sample-excel-file
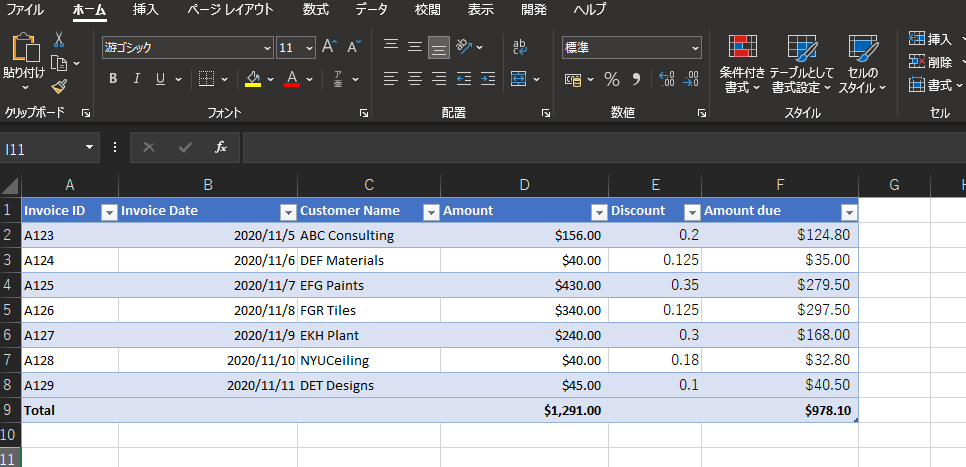
https://docs.microsoft.com/ja-jp/office/dev/scripts/resources/samples/email-images-chart-table#sample-excel-file
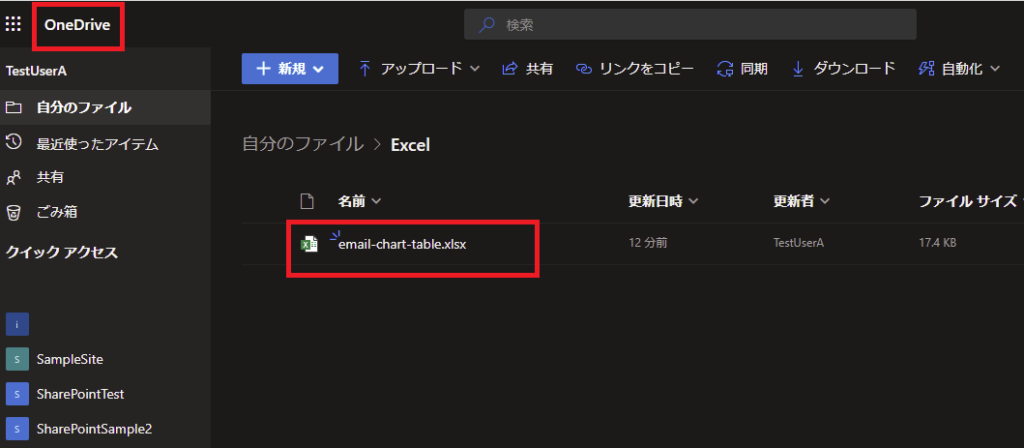
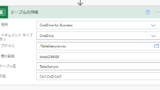
そのExcelをOneDriveとかSharePoint OnlineとかのExcel Onlineで使用できる場所にアップロードする。
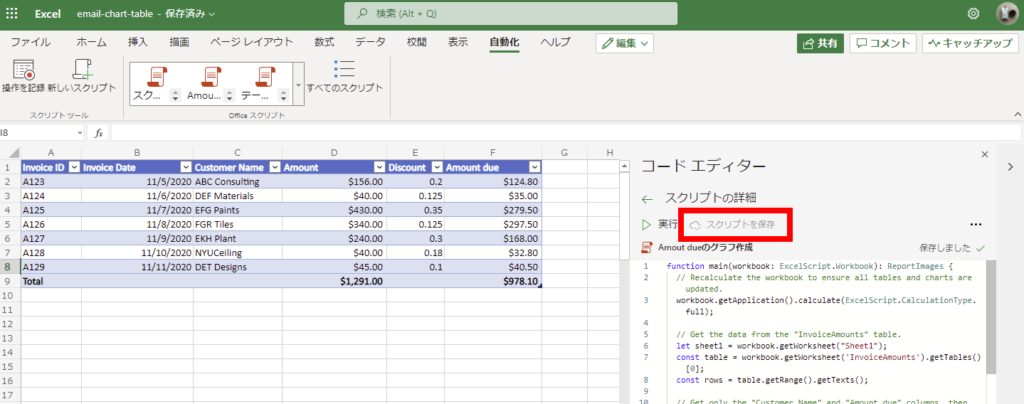
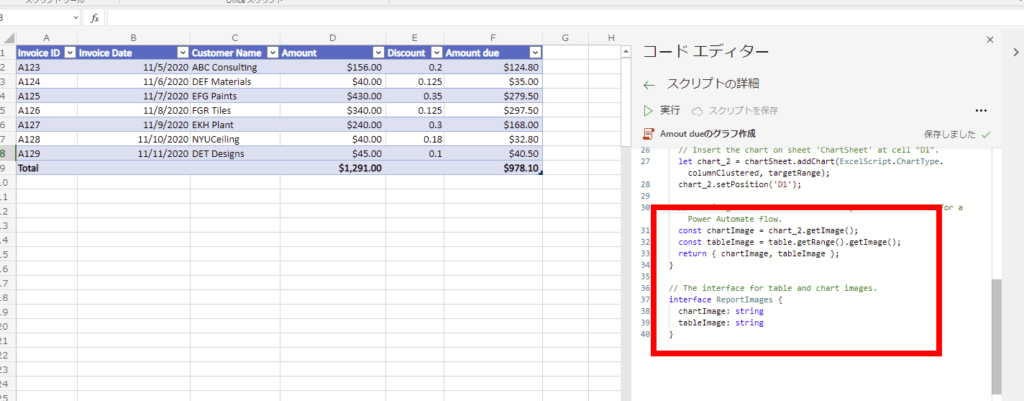
そしたらそのファイルをExcel Onlineで開いて、[自動化]タブの[新しいスクリプト]を選択し、コードエディターを開く。
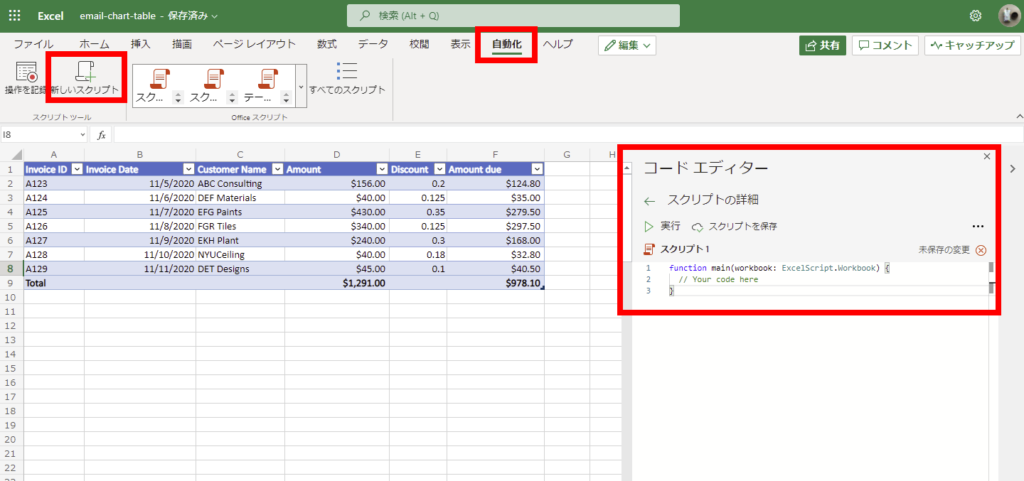
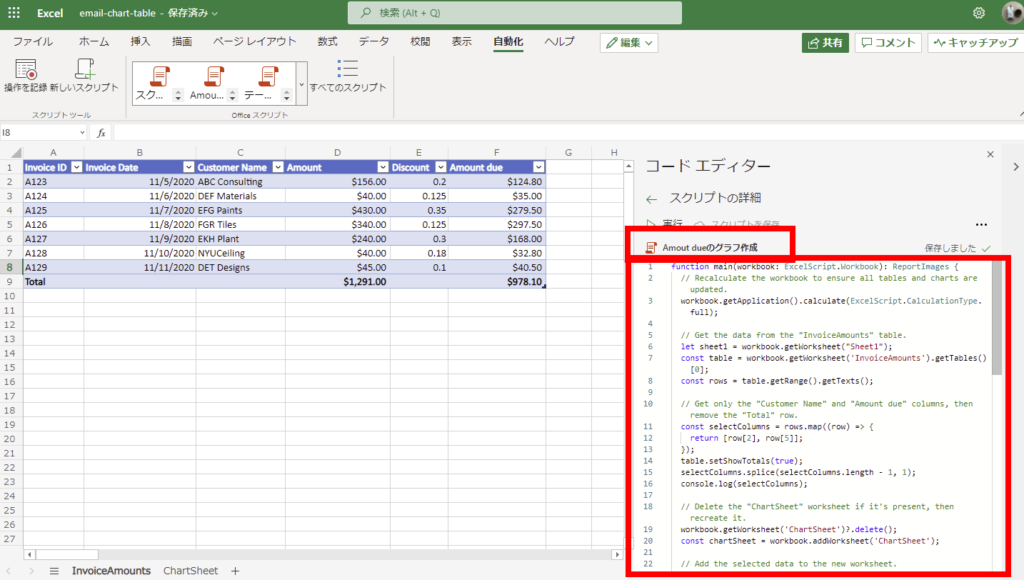
エディターの中に参考サイトのコードを入力して、スクリプト名をいい感じにつけてあげる。
https://docs.microsoft.com/ja-jp/office/dev/scripts/resources/samples/email-images-chart-table#sample-code-calculate-and-extract-excel-chart-and-table
https://docs.microsoft.com/ja-jp/office/dev/scripts/resources/samples/email-images-chart-table#sample-code-calculate-and-extract-excel-chart-and-table
スクリプトを保存したらExcel側の準備は完了。
Power Automate実装
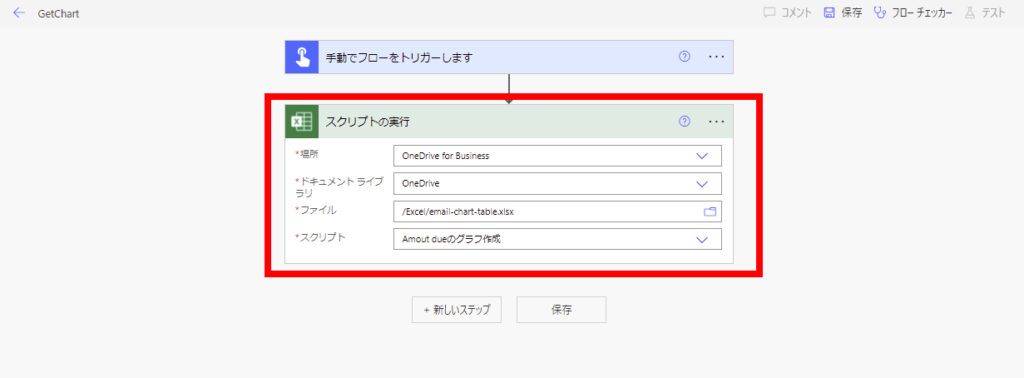
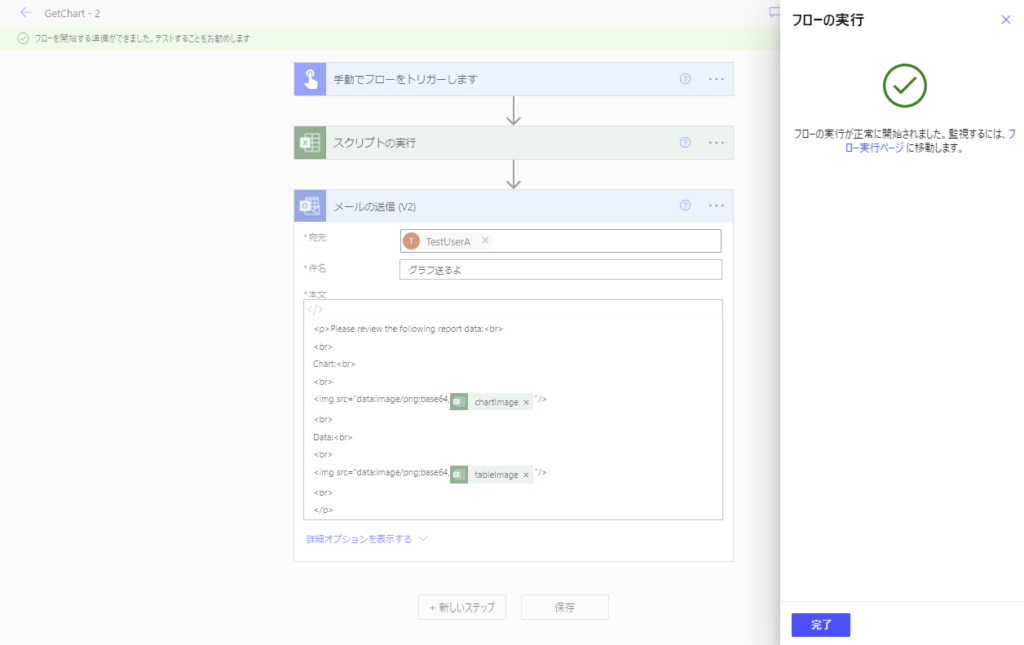
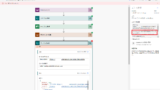
そしたら適当なトリガーでPower Automateのフローを作成し、Excel Onlineの「スクリプトの実行」アクションを追加。
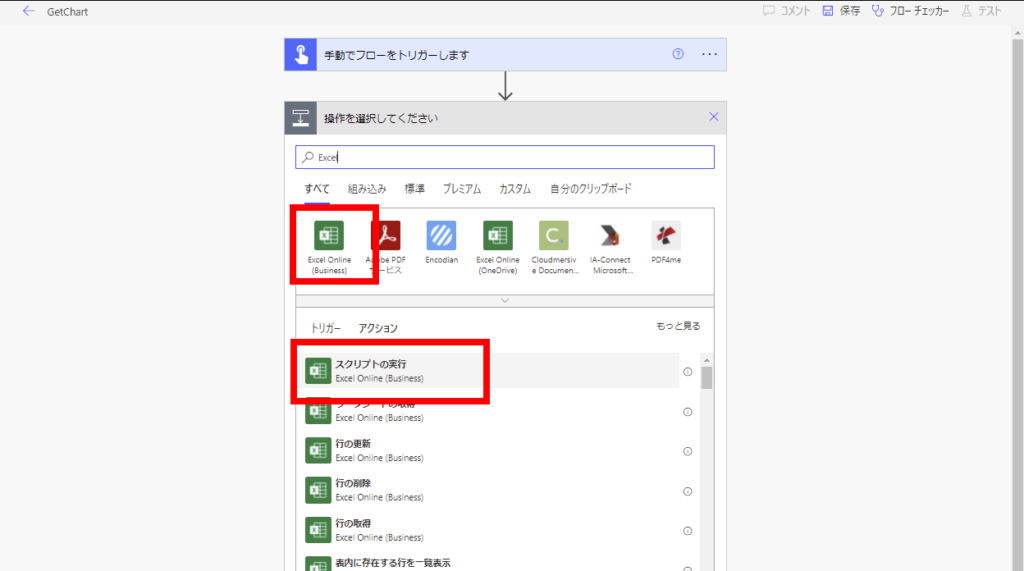
さっき作ったExcelとスクリプトを指定してあげる。
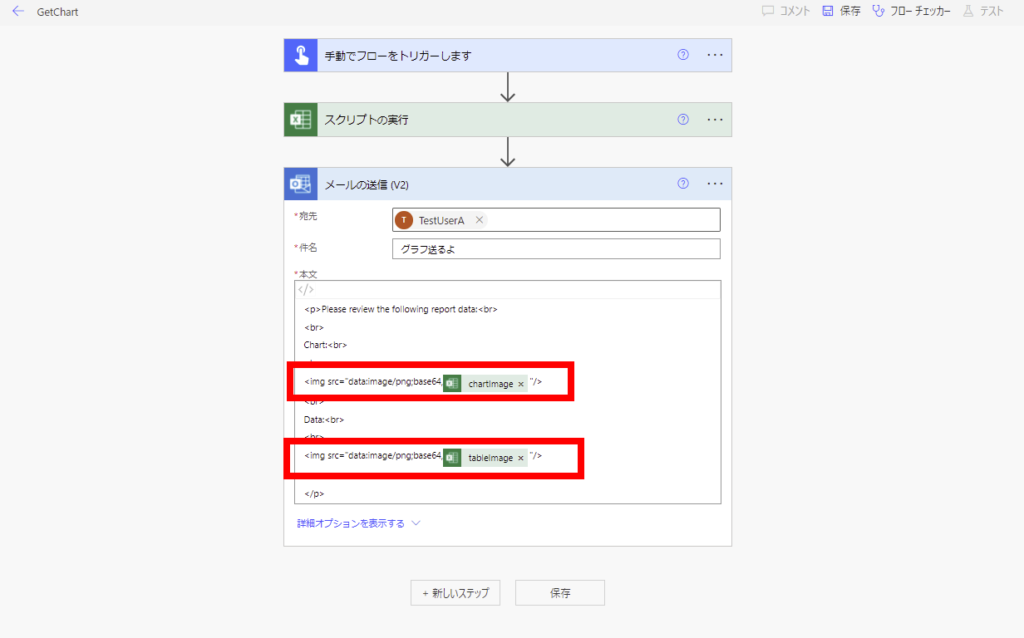
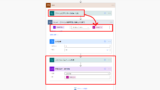
そしたらOutlookのメール送信アクションで参考サイトに書いてある本文を入力し、「スクリプトの実行」アクションからの戻り値を入れてあげる。
https://docs.microsoft.com/ja-jp/office/dev/scripts/resources/samples/email-images-chart-table#power-automate-flow-email-the-chart-and-table-images
https://docs.microsoft.com/ja-jp/office/dev/scripts/resources/samples/email-images-chart-table#power-automate-flow-email-the-chart-and-table-images
※スクリプトの戻り値はこんな感じ。
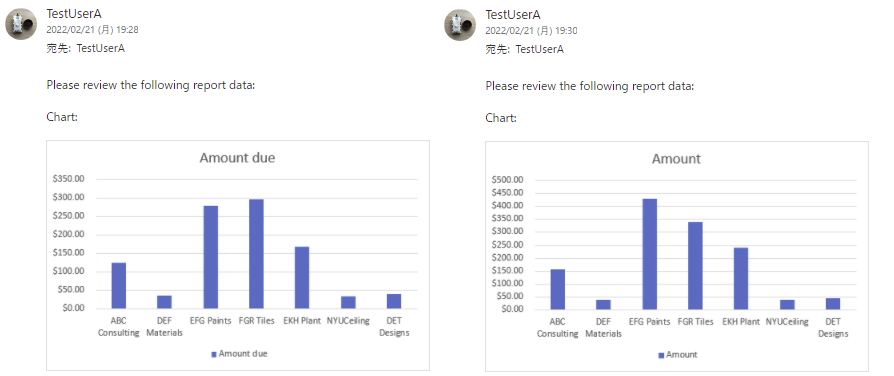
実行
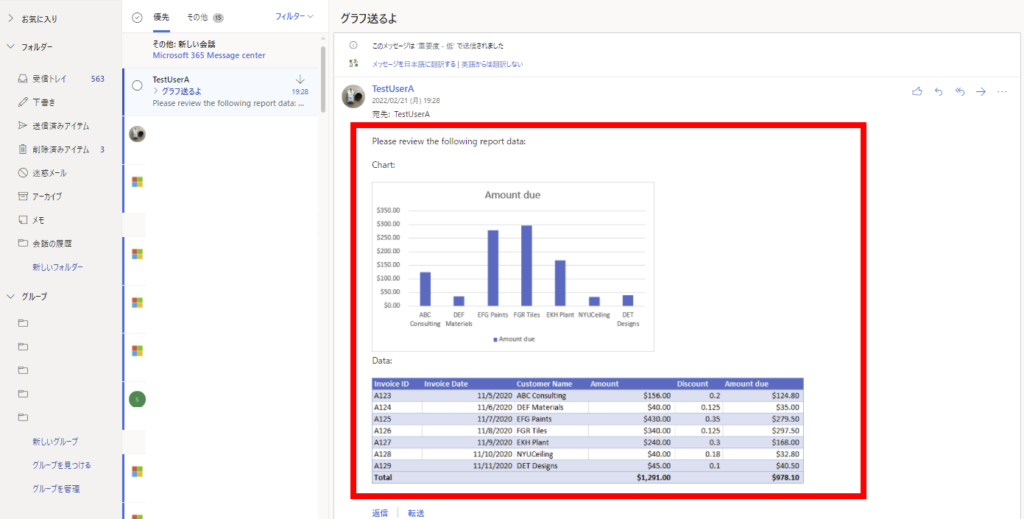
そしたらこのフローを実行してみると、
メールが届いてこんな感じでTypeScriptで作成したグラフが画像として送られてくる!
もちろんTypeScriptの方のコードを修正すると、
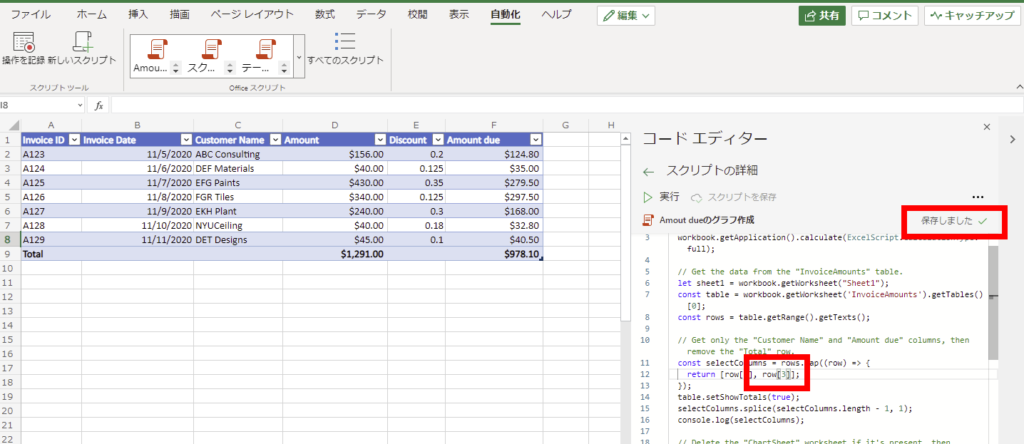
こんな感じで作成/送信するグラフを変えることもできる!
Power AutomateとExcelでできることってかなり限られているイメージだったけど、この「スクリプトの実行」アクションを活用することで色んなことができそうな予感!
コメント