Power Appsでデータの一覧表示を実現するコントロールには「ギャラリー」と「データテーブル」がある。
今回はこの「データテーブル」について詳しく調査したので、基本的な使い方やギャラリーとの違いをメモ。
※2025/2/6追記:モダンコントロールについてはこちら
![]()
Power Apps テーブル モダンコントロールの使い方を詳しく解説|委任や複数選択、範囲選択の使い方など
モダンコントロールの一つ『テーブル』コントロールについて詳しく調べたので、その内容をメモ。テーブルテーブルはモダンコントロールの一つで、データを表形式で表示することができる。今回はこのテーブルコントロールについて詳しく調べてみた。※クラシッ...
ippu-biz.com
2025.02.06
データテーブル
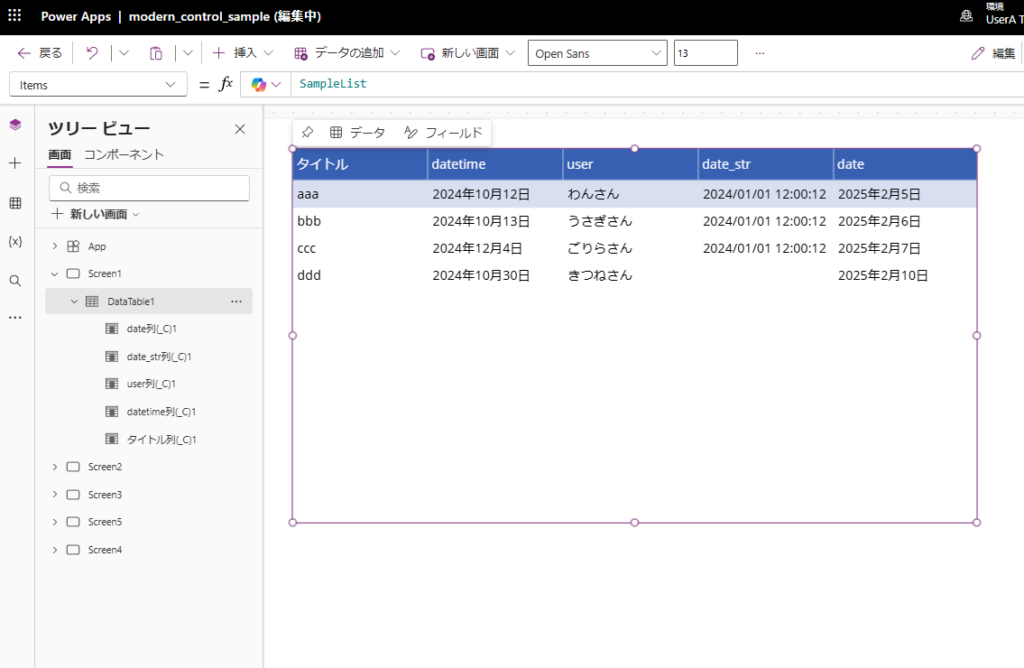
データテーブルコントロールはデータをExcelのようにテーブル形式で表示できるコントロール。
例えばSharePointリストを結びつけると、以下のように表示される。
詳しくは公式を見ていただきたいが、この辺がデータテーブルの主な特徴かと。
- 単一選択(複数選択は不可)
- 列幅変更可能(保存はされない)
- ハイパーリンクの表示とクリックでの遷移が可能
- 自動でヘッダーを出してくれる
- スクロールバーが2方向(縦と横)に出る
公式はこちら
![]()
![]()

Power Apps のデータ テーブル コントロール - Power Apps
Power Apps のデータ テーブル コントロールの詳細、プロパティ、および例について説明します。
docs.microsoft.com
基本的な使い方
使い方はとても簡単。データテーブルを追加し、
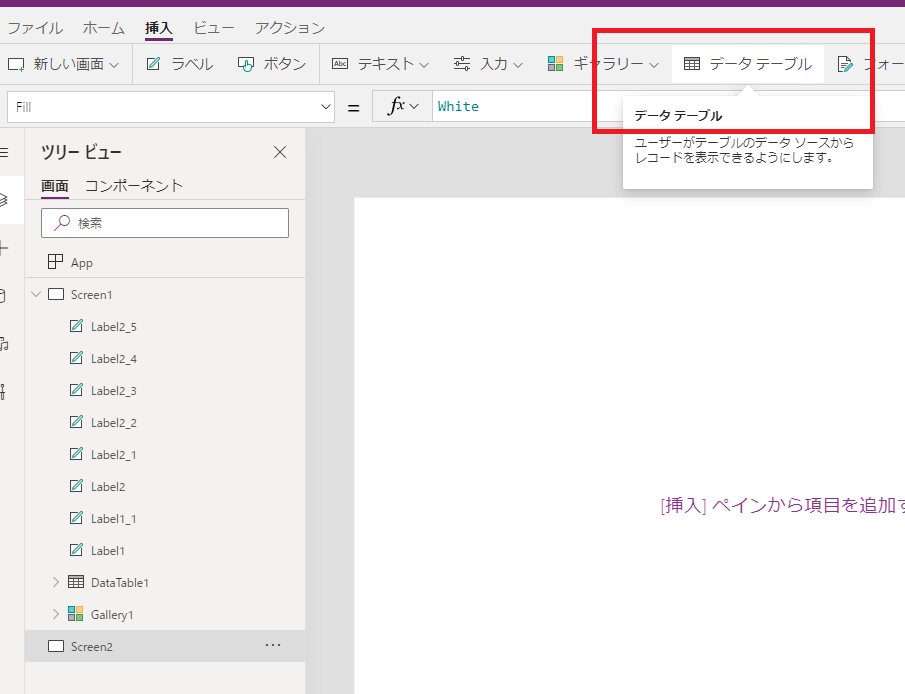
Itemsプロパティにデータソースを設定する。
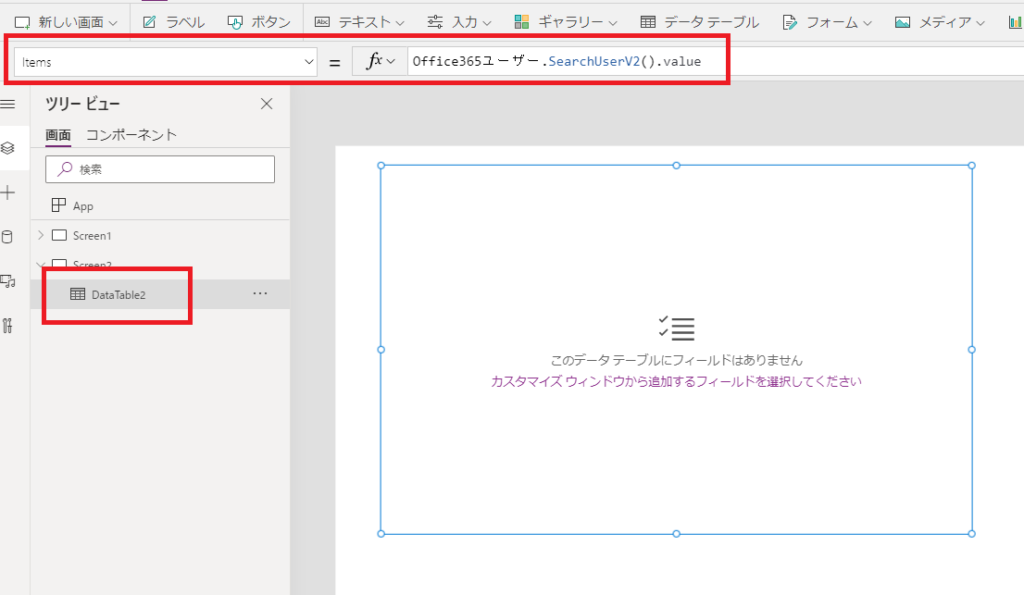
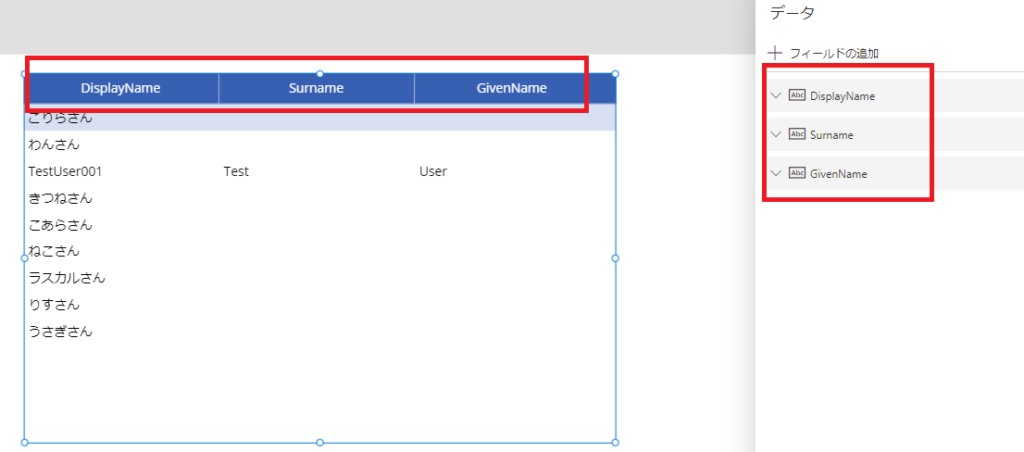
そしたら、「フィールドの編集」から表示したい列を選択すると、
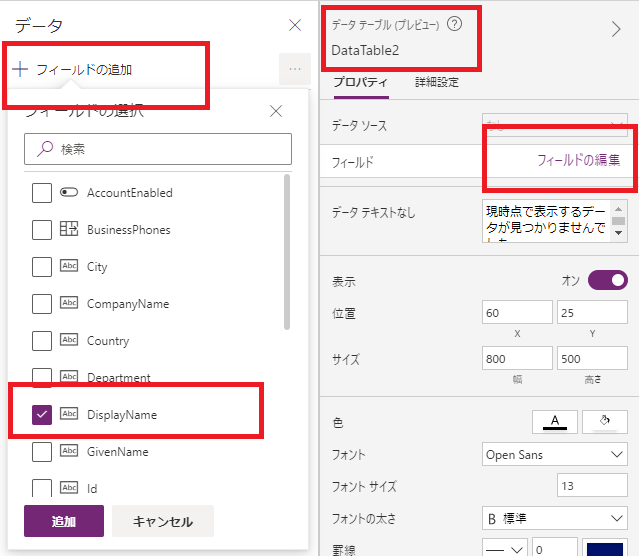
表形式でデータを表示してくれる。
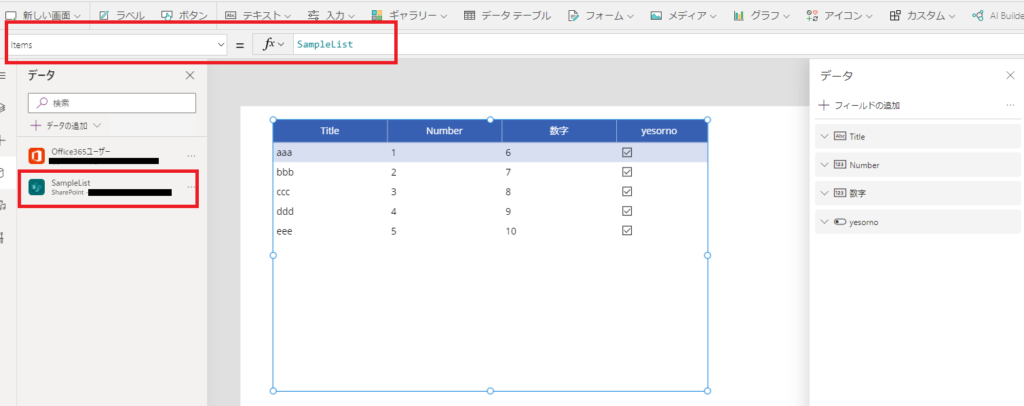
もちろんSharePointのリストなども表示可能。以下のSharePointリストを、
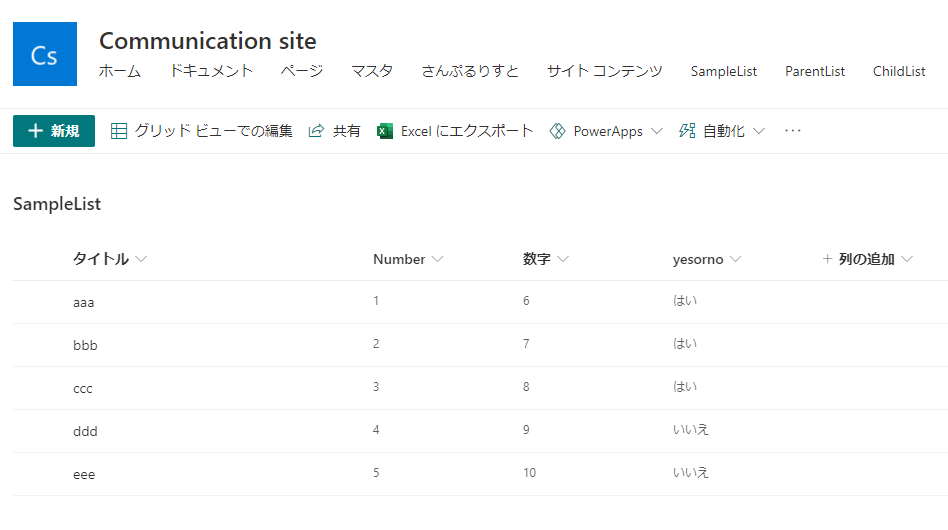
データソースとして追加し、Itemsプロパティに設定すれば画像のように表示される。
データの選択も可能
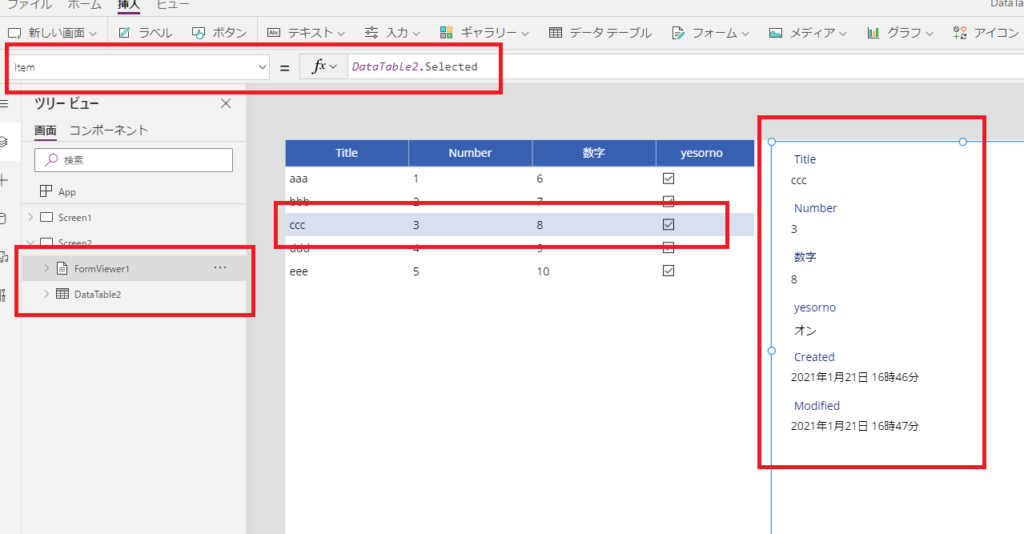
データテーブルは行の選択も可能で、同じDataSourceのフォームを横に追加し、
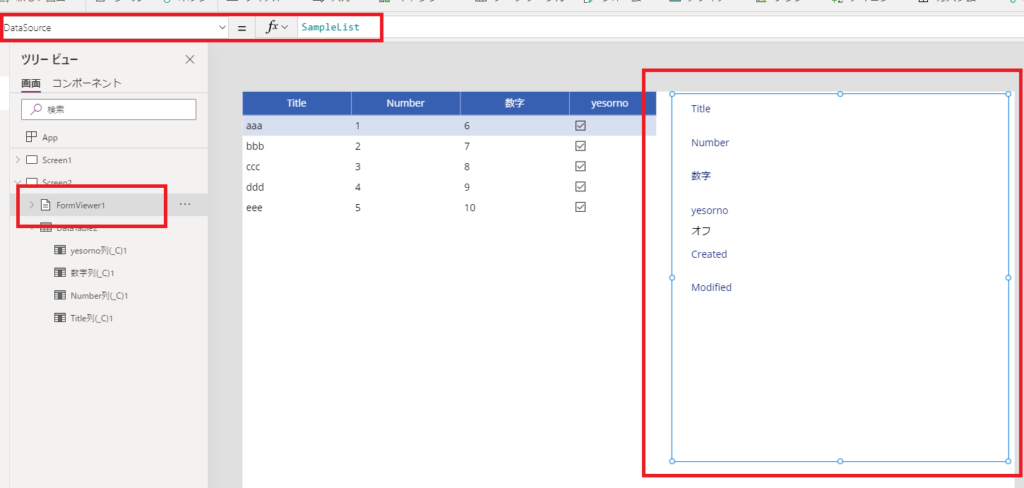
フォームのItemプロパティと、データテーブルのSelectedプロパティを結び付けると、選択しているデータをフォームで表示することも可能。
「ギャラリー」との使い分け
同じようにデータを一覧で表示するコントロールに「ギャラリー」がある。
この2つのどちらを使うか?を考える際は、
- 細かいUI設定はせず、表示する情報量が多い:データテーブル
- 細かいUI設定をしつつ、表示する情報量はあまり多くない:ギャラリー
という感じかなと思っている。
以下、2つの違いを少し細かく見ていく。
スクロールバーの表示の違い
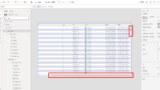
まず、スクロールバーの表示の違いは画像の通り。
- ギャラリー:縦 or 横
- データテーブル:縦と横
こちらの画像は上が「データテーブル」で、下が見た目をデータテーブルに似せた「ギャラリー」で、スクロールバーの違いが一目瞭然。

横にも縦にも情報が多いデータを表示するときはデータテーブルがよさそう。
2023/08/05追記:
ギャラリーも縦にも横にもスクロール可能にできたので、ギャラリーでも上記は要件は満たせる。
![]()
ギャラリーも縦にも横にもスクロール可能にできたので、ギャラリーでも上記は要件は満たせる。
Power Apps ギャラリーを横にも縦にもスクロール可能にしてみる|縦横スクロールバーをGalleryに表示
キャンバスのギャラリーを横にも縦にもスクロールさせる必要が出たので、実装してみた。今回やりたいことこんな感じで縦にも横にもデータがいっぱいのリストをギャラリーを使って横にも縦にもスクロールできるようにしてみる。手順まずは画面に「水平コンテナ...
ippu-biz.com
2023.08.05
見た目の細かい調整
見た目の細かい調整は圧倒的にギャラリーの方が上。
ギャラリーは画像やアイコンを簡単に追加でき、コントロールごとにOnSelectも指定できる。
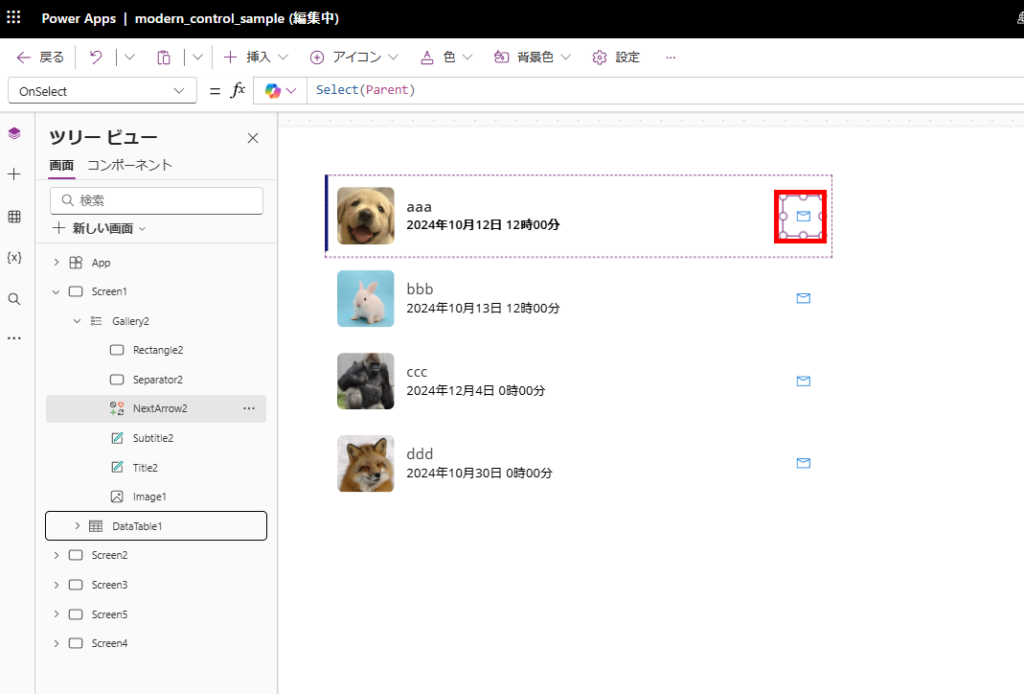
一覧表示したデータをある程度見た目よく表示したいときはギャラリーの方がおすすめ。
列の追加 → データテーブルはLookUpが使えない?
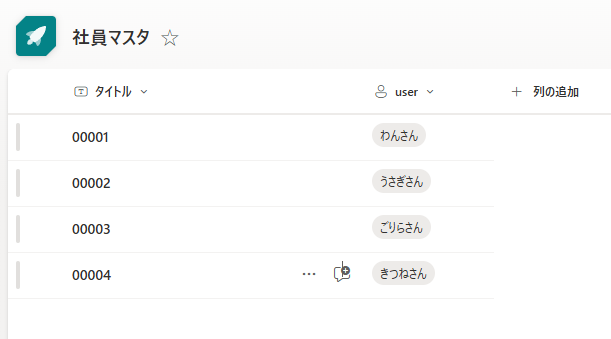
例えばこんなマスタがSharePointリストにあり、Power Appsの画面に列を追加して社員番号(タイトル列)も表示したい、となったときを考える。
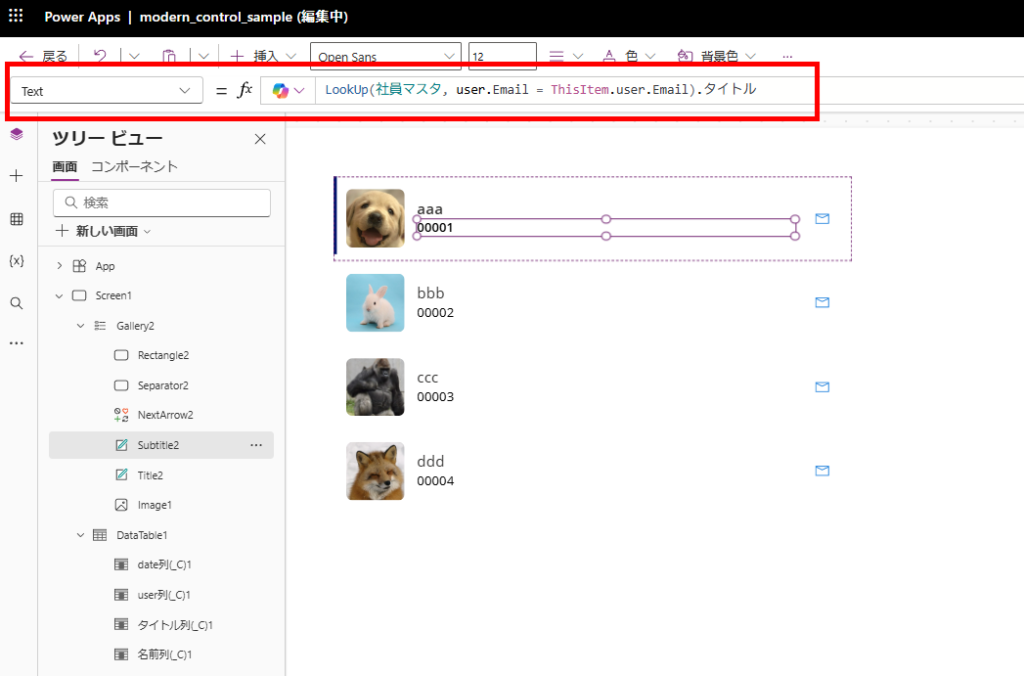
ギャラリーは単純にLookUpを使ってデータを取得すればよいが、
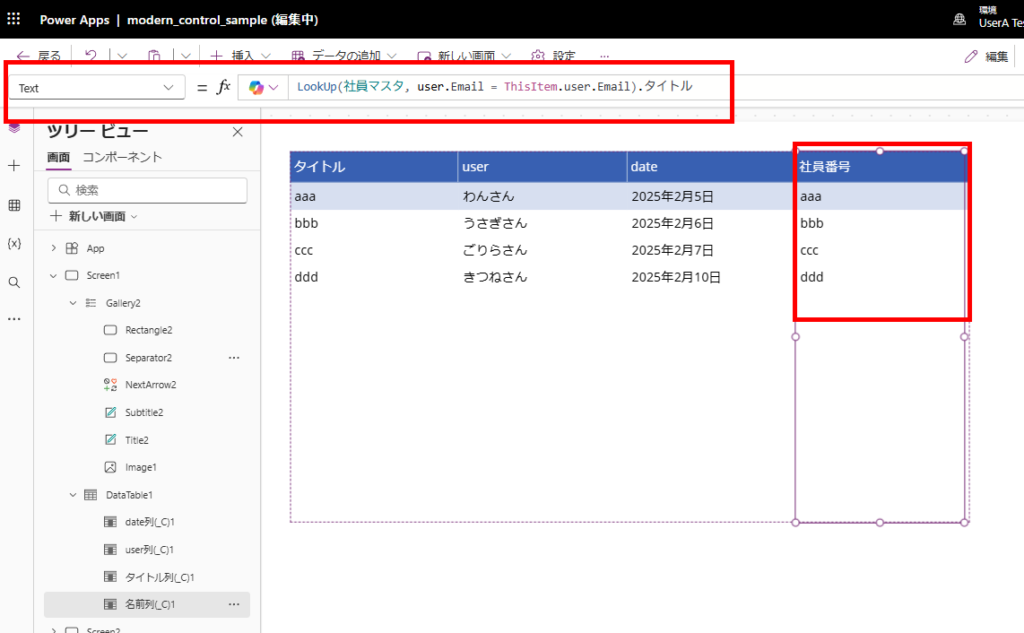
データテーブルでは同じLookUp式を使っても、なぜか表示されない。。
そこで、Itemsに入れるデータ自体をAddColumnsとかで編集する必要がある。
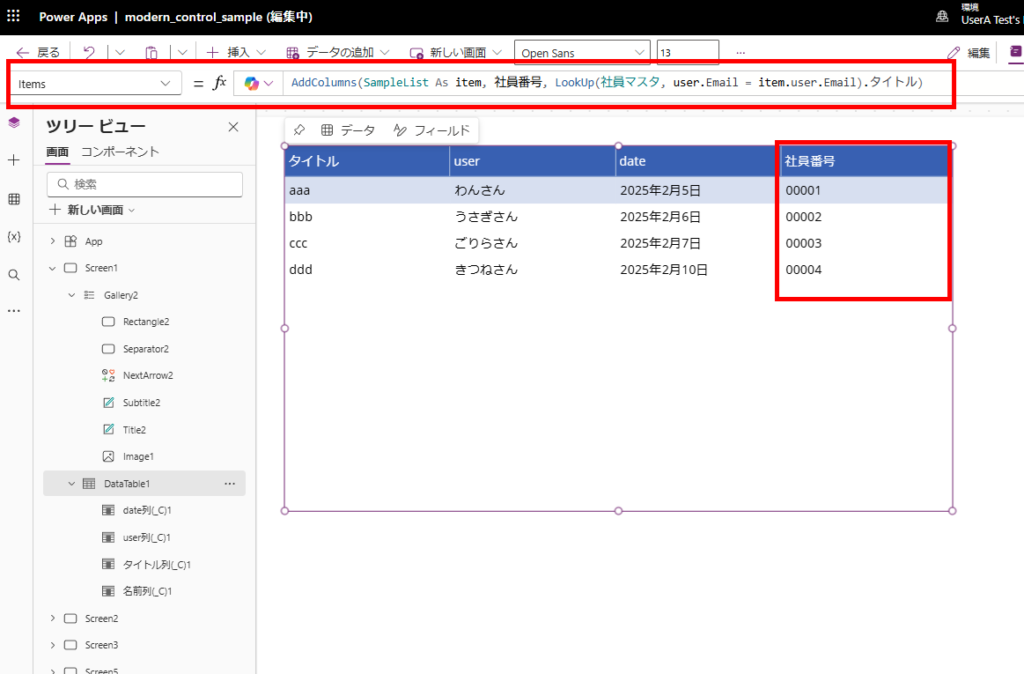
※ただAddColumnsを使用すると「遅延読み込み」が使えないため、「データ行の制限」分のデータしか表示されない。
![]()
Power Apps:AddColumnsは委任警告なしで500件/2000件制限にかかる?Drop/ShowColumnsの挙動検証
ギャラリーに対してAddColumnsを使っているとき前々から微妙な違和感があって色々と調べてみたところ、おもしろい記事をいくつか見つけたのでメモ。今回見つけた記事今回見つけた記事がこちら。結論から言うとどうやらAddColumnsは委任で...
ippu-biz.com
2022.01.24
一覧表示したデータごとに「処理を追加したい(表示を増やしたい)」場合はギャラリーの方が融通がききそう。
データテーブルは他のコントロールからItemsへアクセスできない
データテーブルは一覧表示しているデータに対し、他のコントロールからアクセスすることができない。
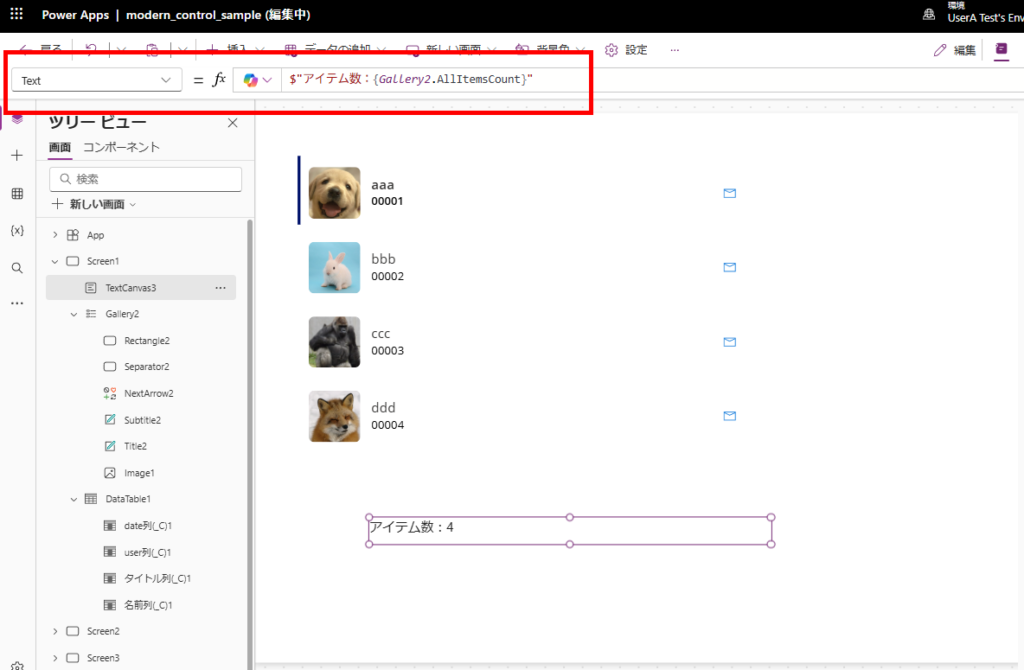
例えば一覧表示したデータの個数を数えたいとき、ギャラリーだとAllItemsCountプロパティ(または式「CountRows(AllItemsCount)」)を使えば実現でき、
※ただし遅延読み込み機能があるので、その時点で読み込みが完了しているアイテムの数になる。
※ただし遅延読み込み機能があるので、その時点で読み込みが完了しているアイテムの数になる。
ForAll関数とAllItemsプロパティを組み合わせるとループ処理も可能だけど、データテーブルはこのAllItemsプロパティに当たるプロパティがない。。
そこで、データテーブルのデータの個数を数えたい場合は、DataTableのItemsに入れたデータと同じデータをカウントする必要がある。
※この場合もちろん委任警告は発生する。
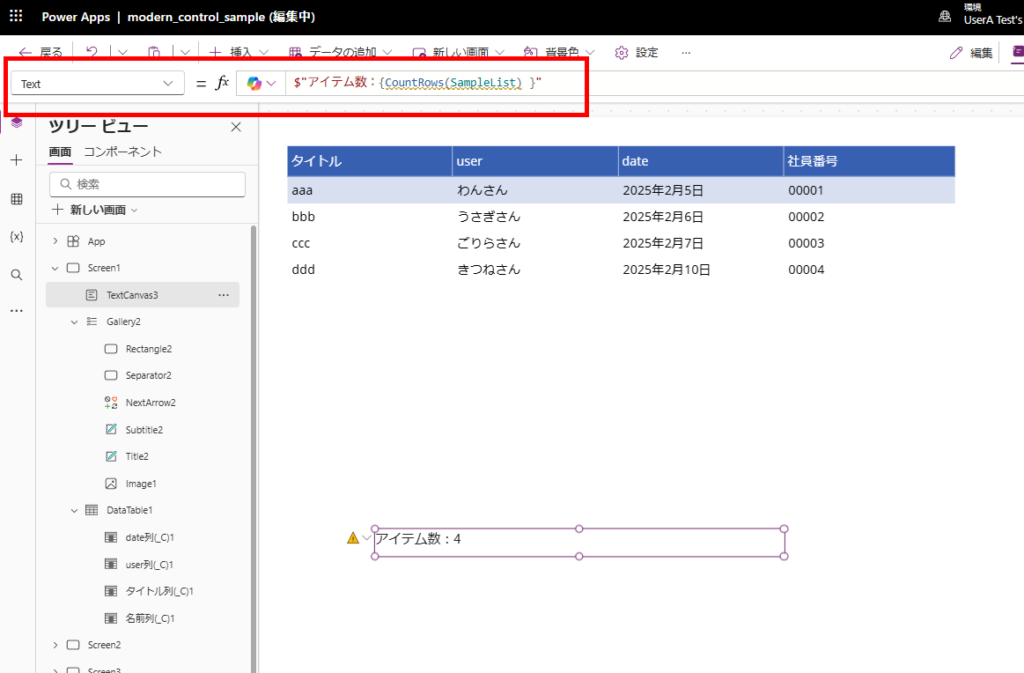
※この場合もちろん委任警告は発生する。
結論
ということで、冒頭でも述べたけど、
細かいUI設定はせず、各データへのアクセスもせず、表示する情報量が多いデータを扱う場合は「データテーブル」を、
細かいUI設定がしたい、または各データへのアクセスがしたい場合や、表示する情報量が少ないデータを扱う場合は「ギャラリー」を、
選ぶのが良いかと。
ちなみに体感だけど、表示速度はデータテーブルの方が速そう(あくまで体感)。
コメント